Hand us the figure.
Keep the science.

Publication-grade figures. Certified to spec.
Yours to publish. Yours alone.
You keep the work, the data, and the credit.

NDAs available
Source
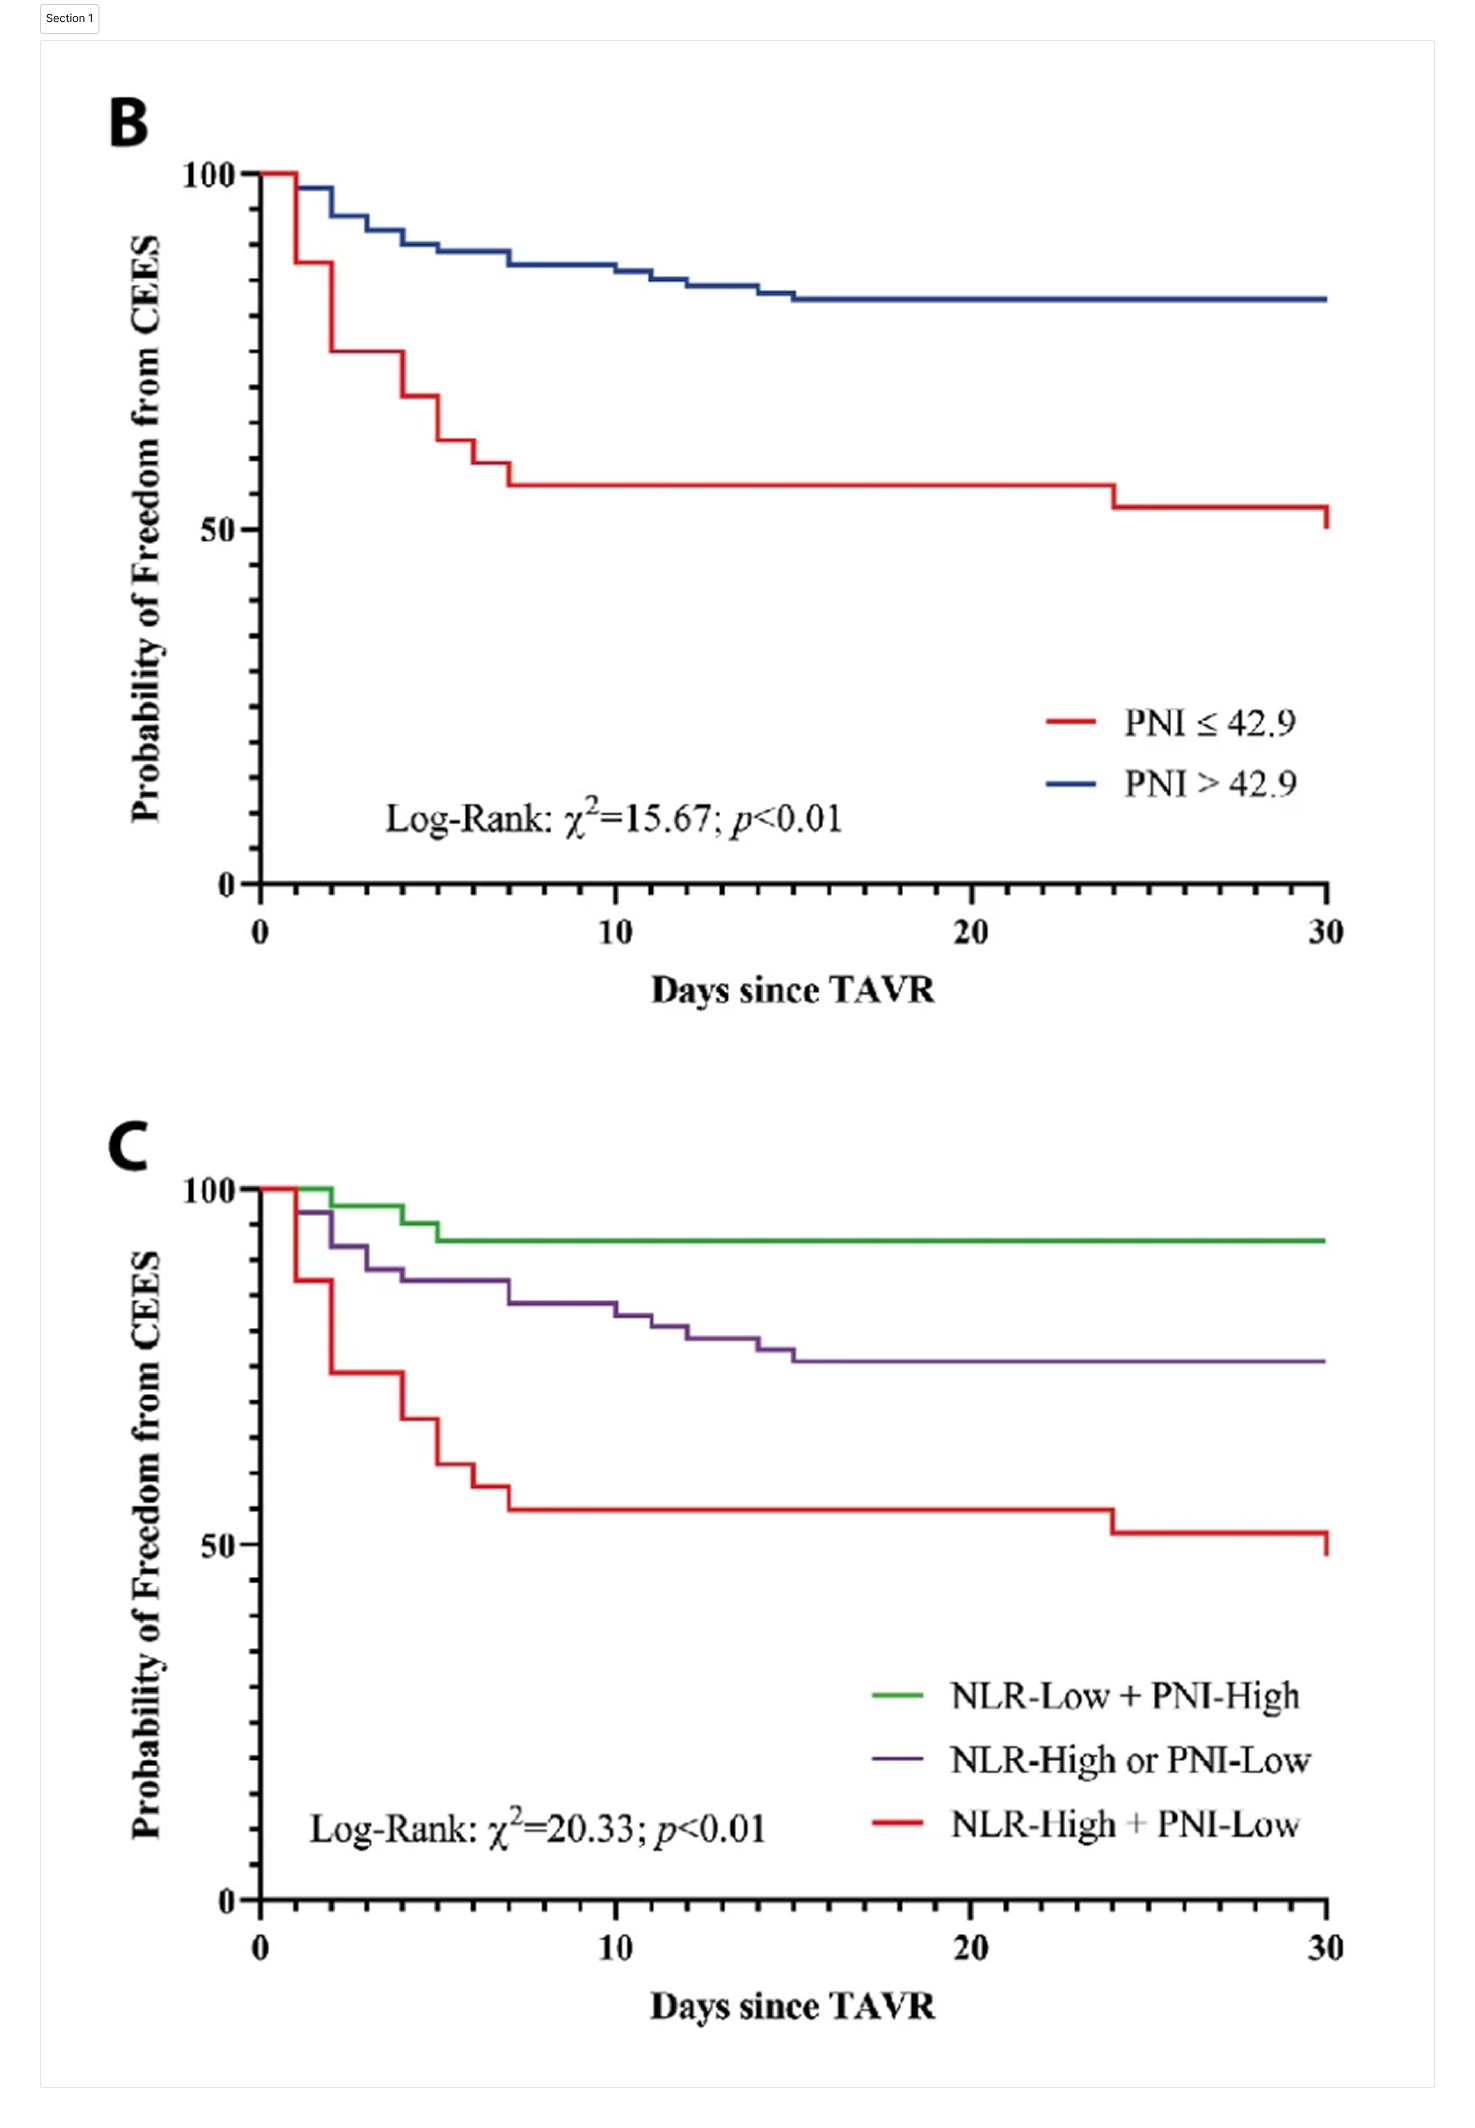
Original Kaplan–Meier figure (scanned)
PDF page 7 JPG · 96 dpi
Redraw
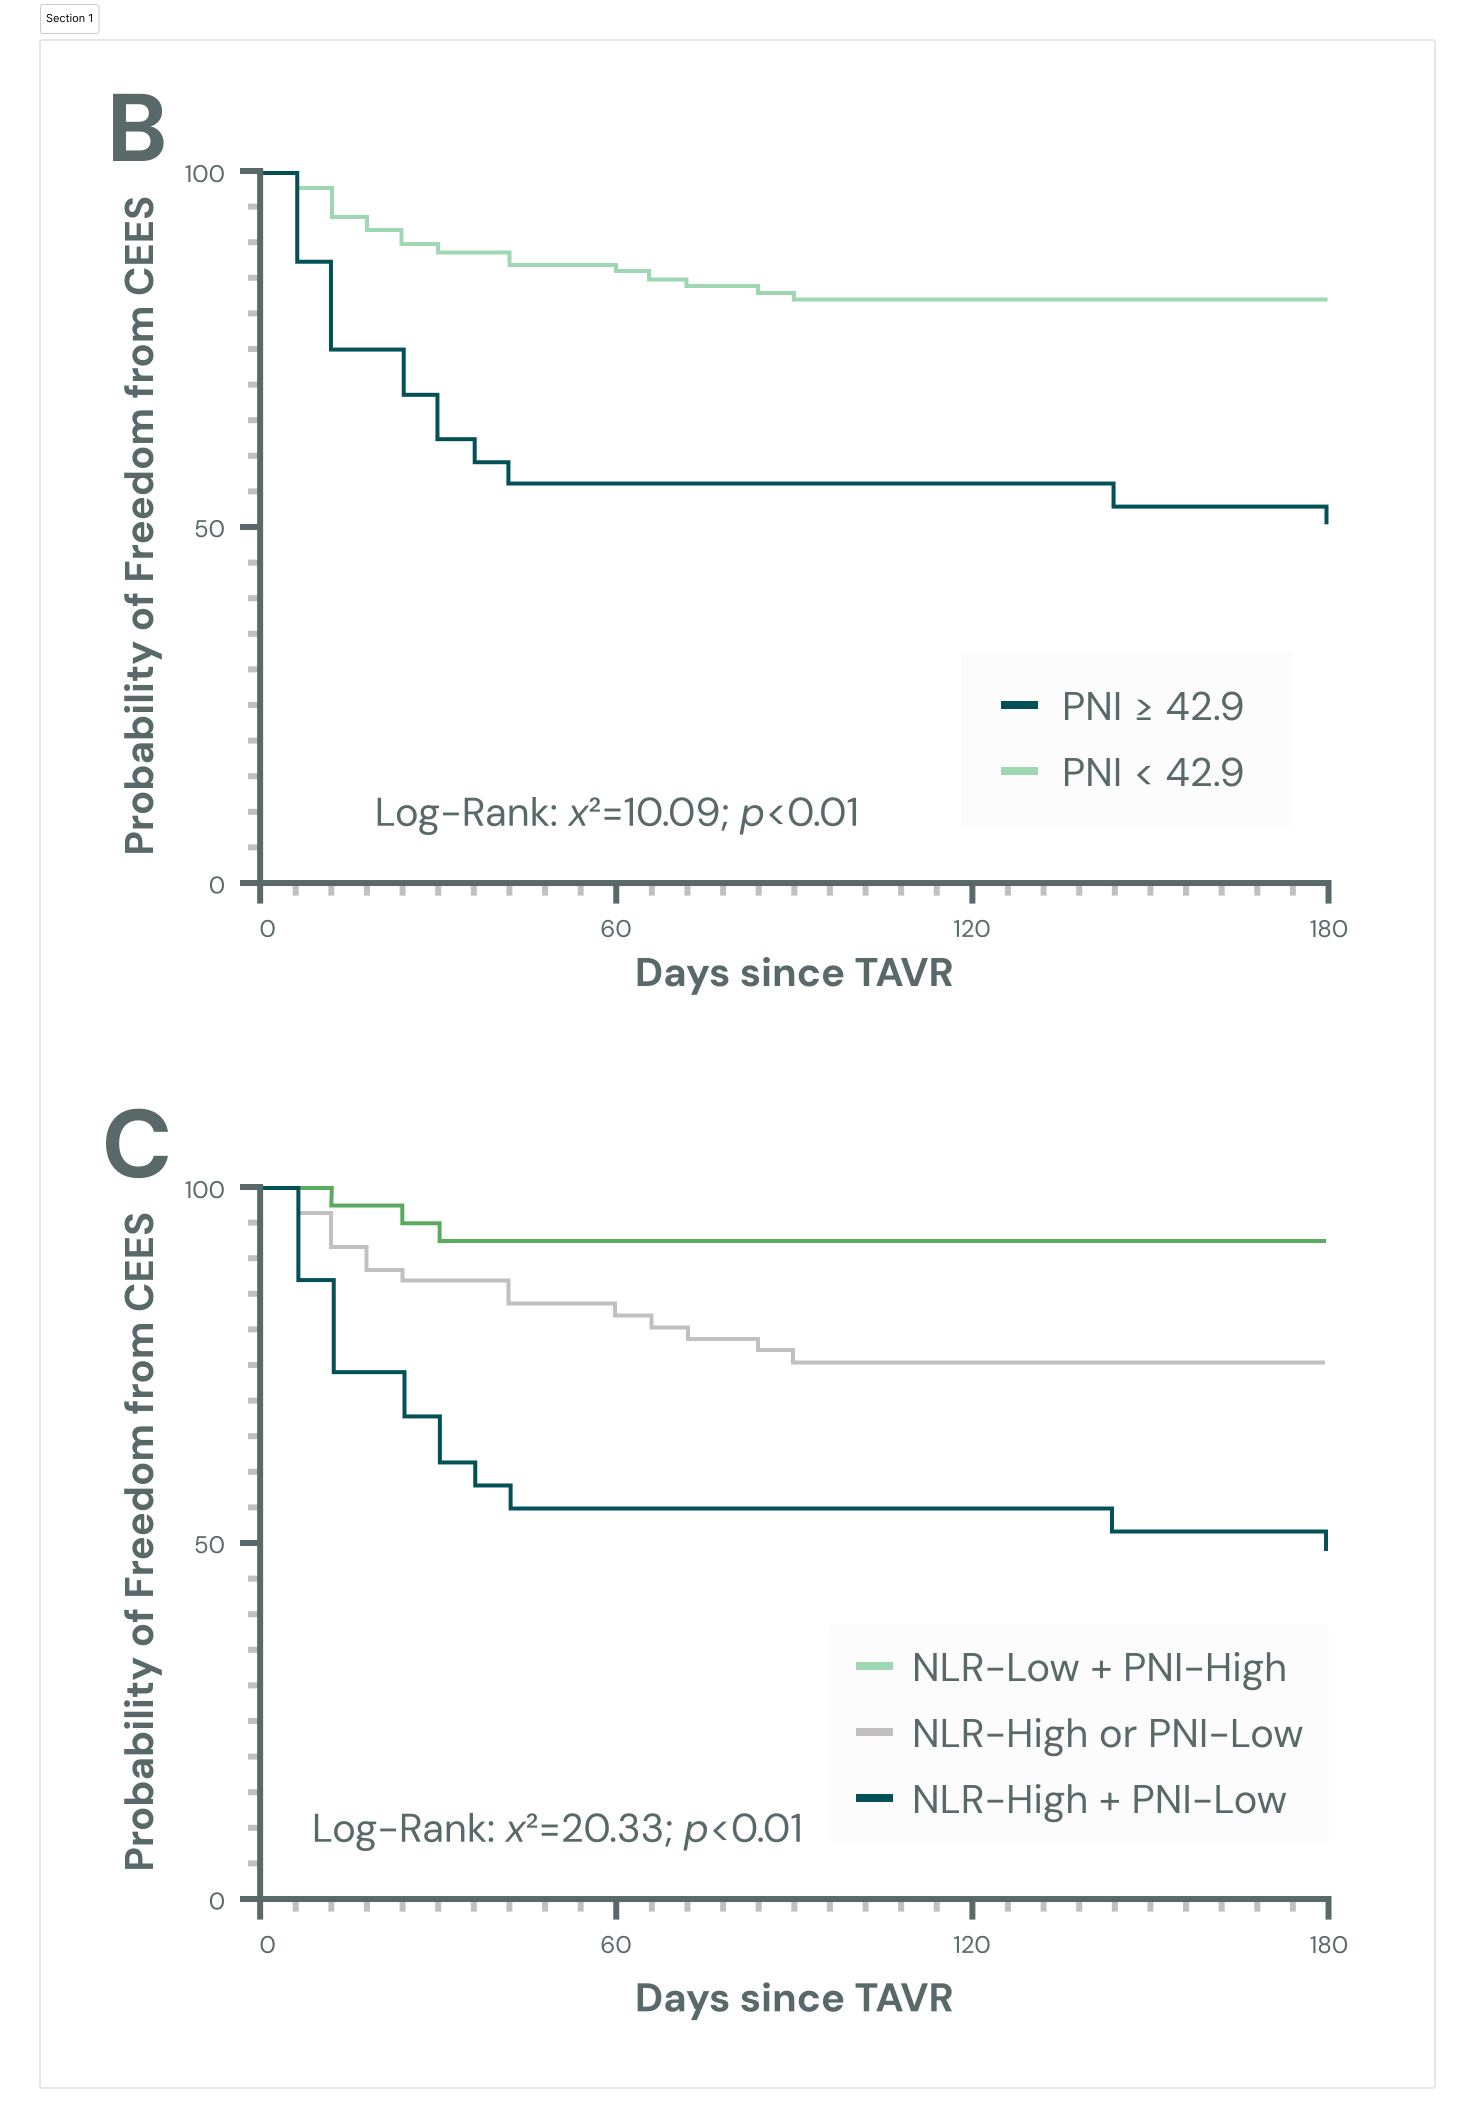
Redrawn Kaplan–Meier survival curve
Vector · AI · SVG · PDF 300 dpi
The guarantee

Guaranteed to spec and error-free,
for one flat fee.

01

A signed provenance certificate with every order.

Your figures are delivered with a provenance certificate validating that no errors were introduced in the process.

After a rigorous QC process — including screening against a proprietary index that proactively catches the issues figures get kicked back for — your certificate is signed off by an approving human expert.

02

No AI, ever. Real confidentiality, guaranteed.

iRefigure does not use AI. Your unpublished data never touches a model.

Confidentiality isn't a setting we toggle — it's how the service is built. Nothing you send is used to train anything, and nothing leaves the people working on your order.

Because accuracy and confidentiality are never compromised, your science stays yours.

What we do

A practical service for teams who need figures to look the part without spending a week in Illustrator.

Production-ready scientific figures

We match your brand colors, fonts, and style guide exactly. Figures arrive ready for upload with your journal submission, or for dropping into a deck or detail aid.

Charts from any source image

Bar, line, scatter, Kaplan–Meier, forest, box, donut, multi-panel. Send a JPG, a PDF page, a poster photo, or a slide screenshot, we redraw it.

Editable vector files

Delivered in AI, EPS, SVG, PDF, and PNG. Layered for InDesign, PowerPoint, or web, so your team can edit text, swap colors, or re-scale without losing fidelity.

Selected redraws

Charts we've taken from photocopy to print-ready.

Redrawn Kaplan–Meier survival curve Original Kaplan–Meier figure (scanned) Before After
Phase 3 OS curve Kaplan–Meier
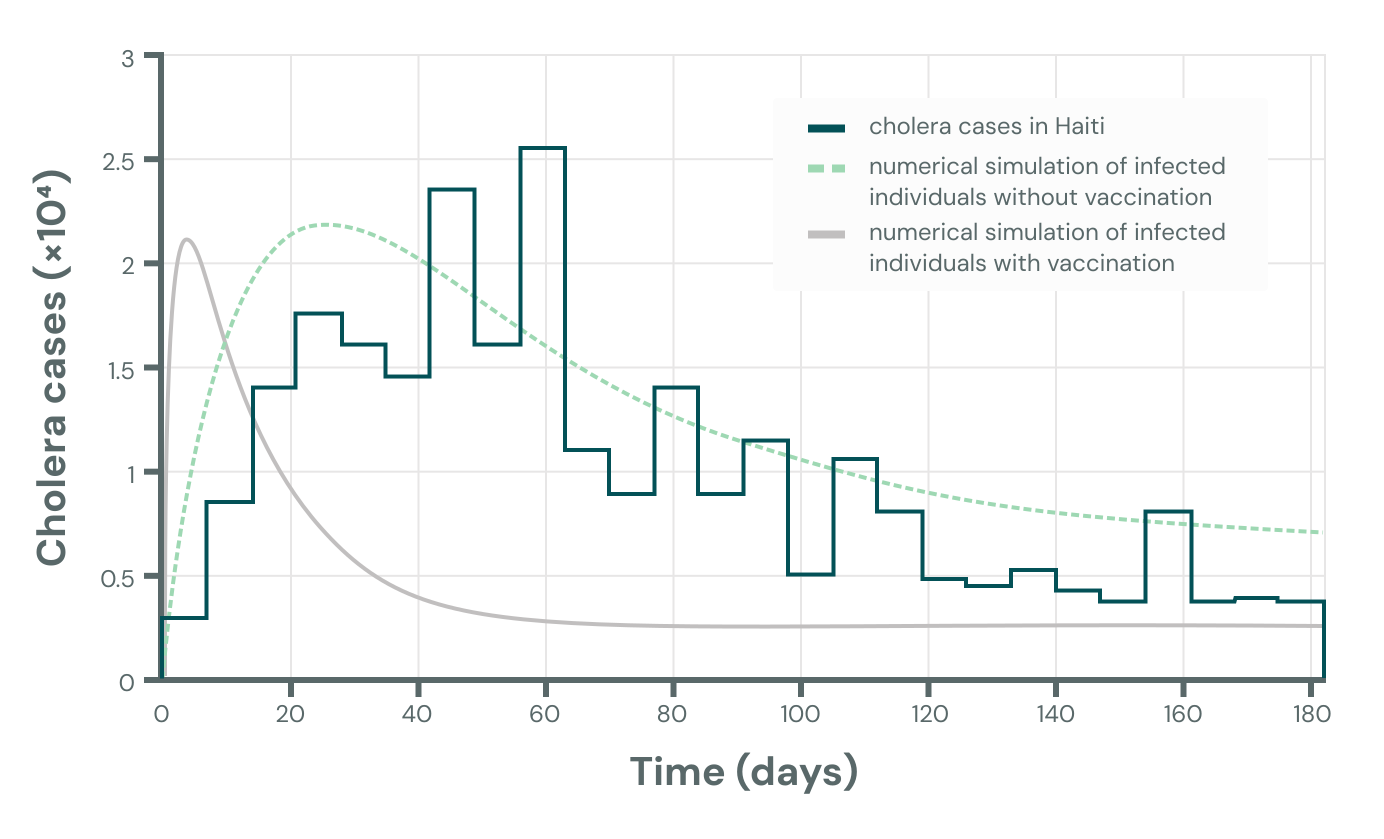
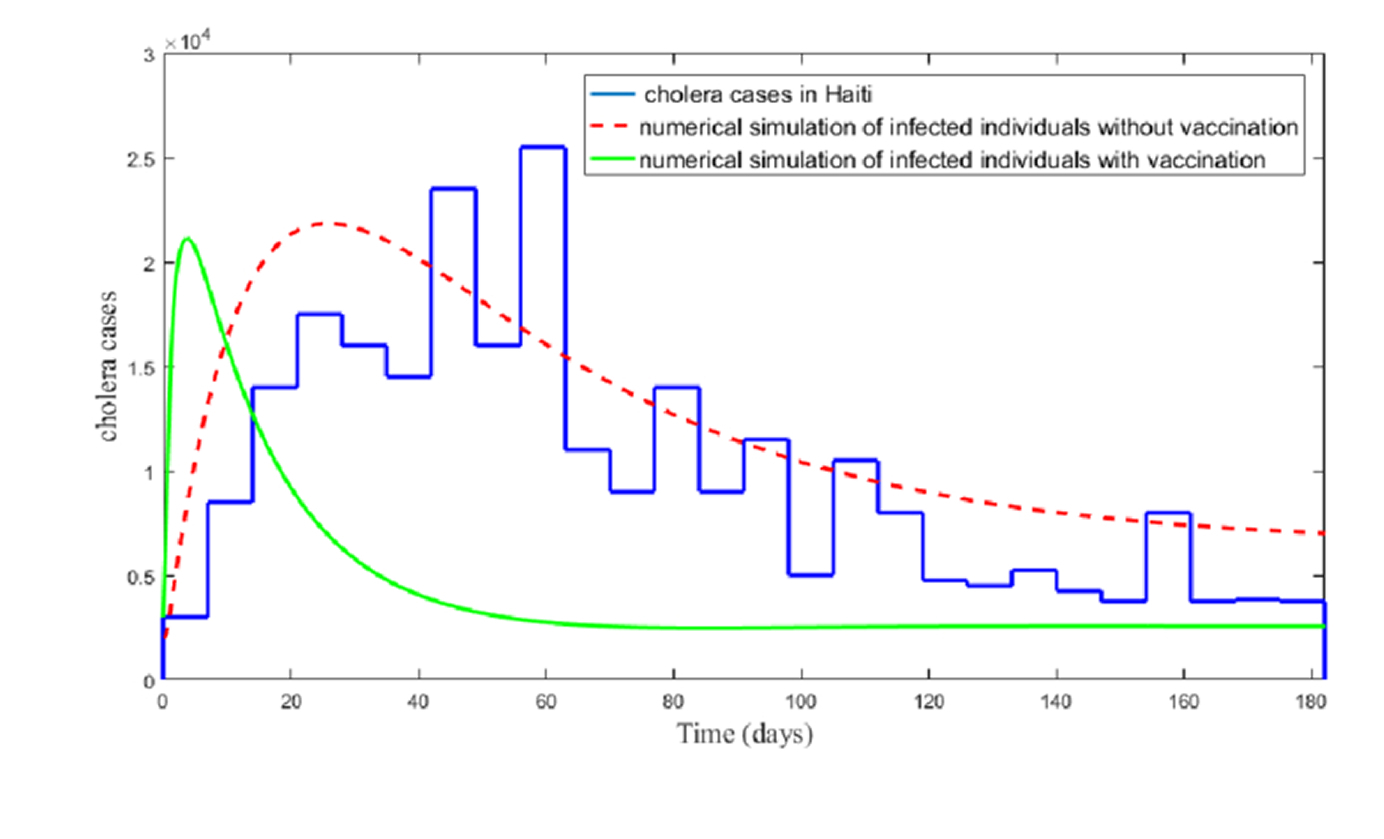
Redrawn cholera outbreak map Original cholera-cases line graph (scanned) Before After
Cholera-cases line graph Cholera-cases line graph
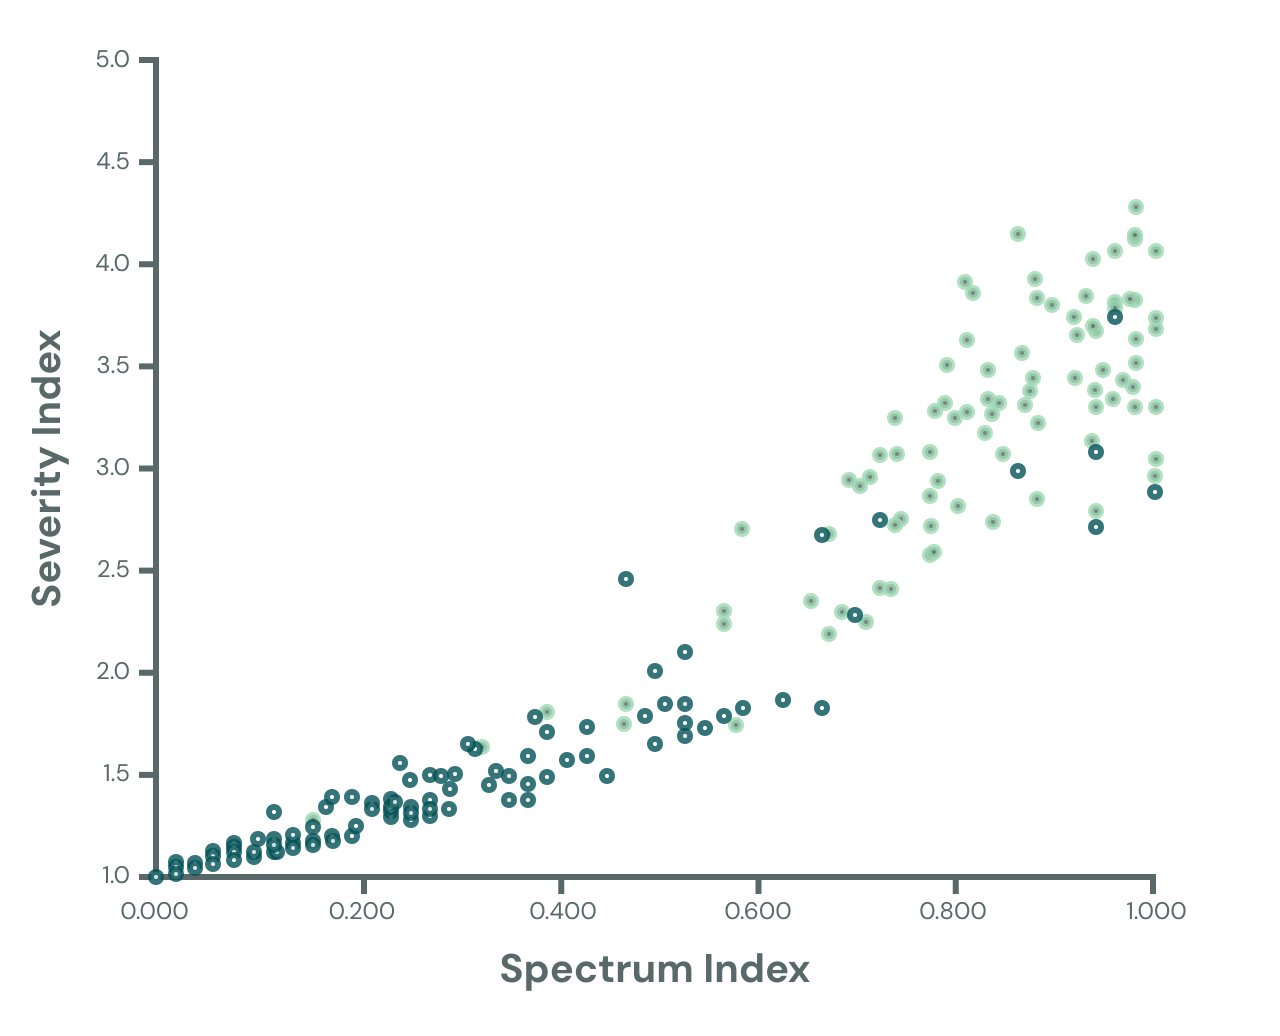
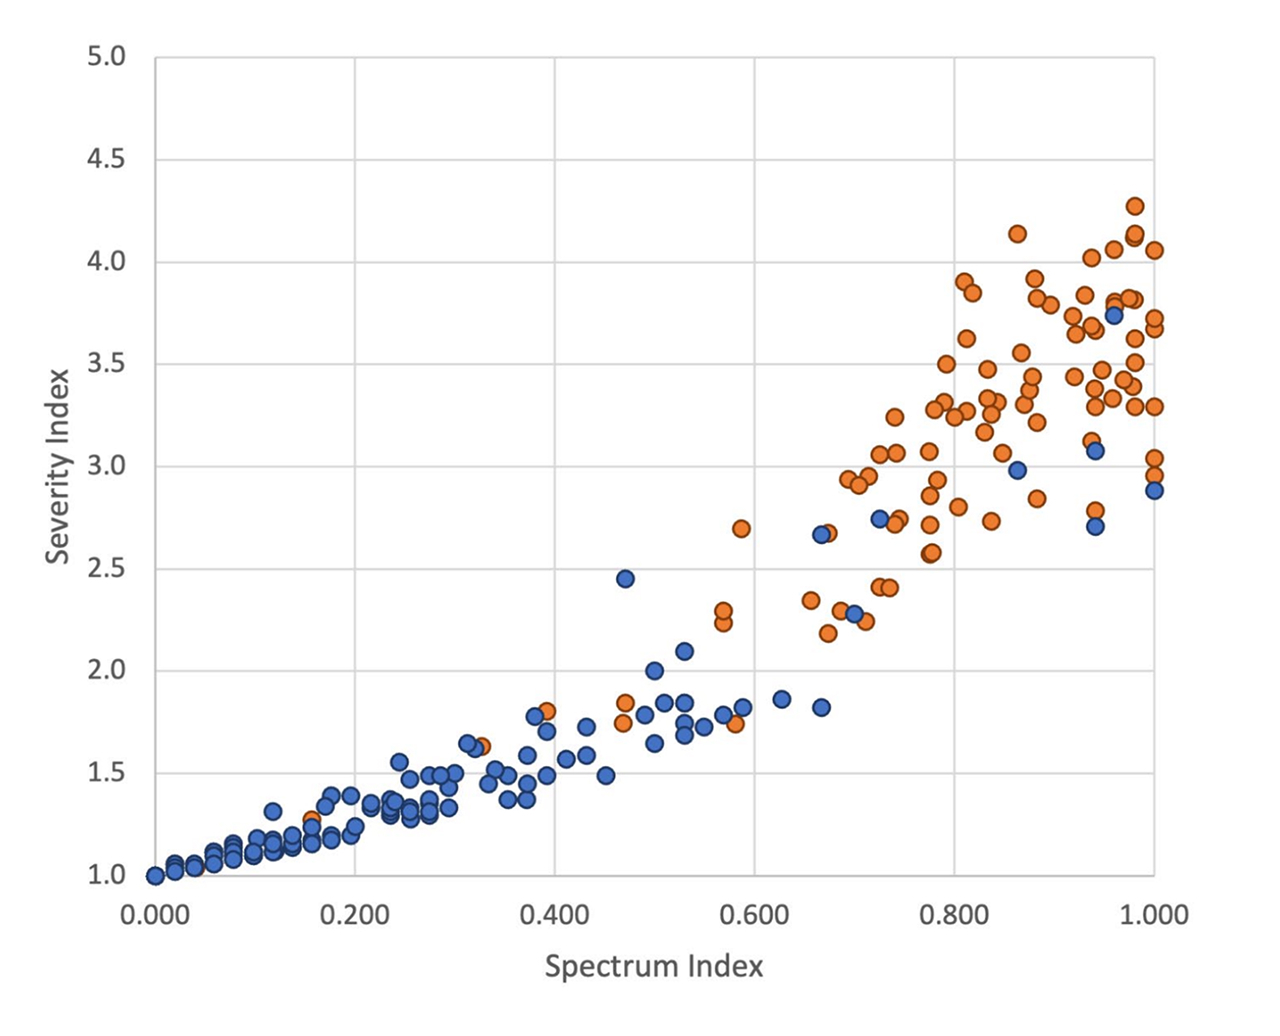
Redrawn correlation scatter plot Original correlation scatter plot (scanned) Before After
Biomarker correlation Scatter plot
How it works

Order, redraw, deliver.

Read full process →
Step 01

Order your Refigures.

Upload source charts, pick output formats, share brand assets or a style guide.

Step 02

We Refigure them.

3 business days. Each chart rebuilt in Illustrator, matched to your brand, QC reviewed.

Step 03

Get your certified Refigures.

All formats, layered files, 30-day download link. We archive for 12 months for future edits.

In every order

Standard scope, predictable pricing.

No hidden line items. Everything below is included in the base price.